
Can economic news sentiment inspire entrepreneurship

Variable selection
Economic news sentiment
(1) Large Language Model LERT.
In recent years, with the rise of the artificial intelligence field, machine learning models and deep learning models are gradually applied. In the field of natural language processing (NLP), neural network models have gradually taken the dominant position. A natural language processing (NLP) process is roughly: data acquisition, data preprocessing, feature extraction, task-specific model training and validation, and task-specific prediction. The most important step in natural language processing is model pre-training (pre-train). Model pre-training aims to be trained by a large-scale corpus, where the model can capture a large number of rich linguistic features, which are convenient to migrate to the downstream task (target task). After model pre-training, fine-tuning will be performed, i.e., the pre-trained model will be fine-tuned using a small amount of labeled data to make predictions for downstream tasks.
Pre-trained language models (PLMs) consider rich contextual information and are a successful method for text representation. Among the common pre-trained language models, self-coding pre-trained models such as BERT and RoBERTa are relatively popular in natural language understanding. Self-encoding pre-training models will rely heavily on pre-training tasks to learn contextual information. However, in Chinese scenarios, knowledge is mostly presented in pairs of words, which is difficult to be presented in individual characters, so models such as BERT are difficult to learn complete semantic information and have some limitations. Therefore, in order to solve the above difficulties, a new pre-training model LERT based on the BERT model has emerged. The LERT model utilizes a new linguistically-informed pre-training (LIP) strategy to explicitly include more linguistic knowledge to create weakly-supervised data for the model pre-training, so that more rich linguistic features can be learned. In addition, in terms of training data, BERT uses only encyclopedic corpus training data, RoBERTa uses training data such as news articles, community Q&A, and encyclopedic data, while LERT uses training data consisting of Chinese Wikipedia dumps, encyclopedias, community Q&A, news articles, etc., for pre-training. The experimental results prove (Fig. 1) that the performance of the LERT pretrained model is much better than that of BERT and RoBERTa on all the six Chinese text categorization tasks. Based on the above reasons, we will use the LERT pretrained model with richer linguistic features and better performance for this categorization task.
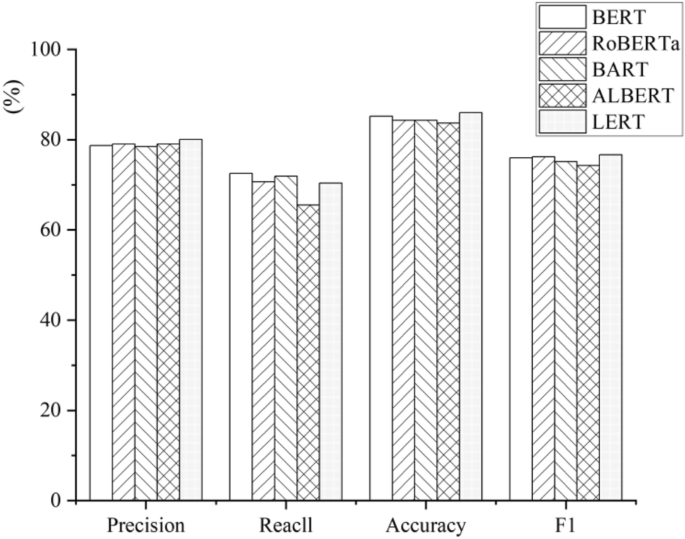
Comparison of classification performance of different models.
(2) Measurement using the LERT model.
Step 1: Determine the object of text analysis.
Online social media, as a low-cost, real-time and interactive way, can be the fastest way to realize the aggregation of public sentiment and thus feel the social development. Therefore, this study adopts the content published on microblogs by the official media of sample cities from January 2013 to October 2024 as the data source, specifically searches for each city as a keyword, and filters out the official microblog accounts of the government of each city, obtaining including “xx release”, We obtained 814 official media accounts, including “xx release”, “xx daily” and so on. Then we obtained all the news content data through web crawler technology, and filtering the content by “economic news” category, got tweeted content pertinent to economic topics, totaling 180,716 pieces of news data. The following dictionaries are used to determine whether a text belongs to financial news: Gross Domestic Product (GDP), inflation, deflation, economy, macro-control, money, finance, interest rates, exchange rates, unemployment rate, finance, stocks, bonds, funds, futures, options, stock exchanges, capital markets, financial derivatives, price-earnings ratios, price-net ratios, financial, assets, liabilities, owners’ equity, operating Income, Cost, Profit, Cash Flow, Accounts, Financial Statements, Investment, Risk, Income, Value Investing, Dividend, Dividends, Compound Interest, Stop Loss, Stop Gain, Financial Policies and Regulations, Tax Law, Accounting Law, Securities Law, Regulation, Compliance, Audit, Antitrust.
Step 2: Constructing statements with predictions and statements to be labeled.
We integrate the title of each tweet and the content of the tweet to form a complete piece of measurement content. In order to improve the data quality, we need to process various special symbols, emoticons and other non-Chinese character form content in the tweets, which has the advantage of reducing the introduction of unnecessary information and improving the model efficiency.
In order to facilitate the subsequent processing of our model, this thesis will just process all the text according to the period and semicolon, to get the final predicted sentence library. Since most of the sentences in the tweets have nothing to do with the keyword “economic news”, if the sentences are completely randomly selected for manual judgment, most of the labels obtained will not match the topic words. Therefore, in order to improve the efficiency of manual processing and prevent errors, it is necessary to use keywords to extract representative sentences from the tweets, which together with the randomly selected sentences form the sentence database to be labeled.
We collected and organized a dictionary of 48 keywords related to “economy” based on policy texts, research reports, and existing literature, and supplemented it with manual reading. Then, we extracted tweets containing 10 or more different keywords and removed the sentences containing the keywords. At the same time, in order to improve the model’s ability to predict sentences without keywords, we randomly selected some tweets without keywords and segmented them into sentences. In order to solve the problem of uneven time distribution, on the basis of these two parts of sentences, we grouped them according to the time period, took out the same number of sentences in each time period, and then carried out random extraction without put-back from this part of uniformly distributed sentences to get the to-be-labeled sentence library of this study. Finally, the to-be-labeled sentence bank of this study contains 1,138,593 sentences.
Step 3: Manual annotation of the sentences in the library of sentences to be labeled.
The idea of manual labeling is based on the aspectual nouns in the sentences to correspond to the adjectives and thus make mood judgments. So, based on this idea, we transform the sentences in the library of substitute labeled sentences. The purpose of manual labeling is to form the training set, validation set and test set, which is convenient for the model to analyze and form the final conclusion.
We organized the 20 researchers into 10 groups, each containing two people, and arranged for them to rotate periodically. In order to ensure a uniform standard for sentence labeling, we set mood seed words and elaborated on the specific requirements for labeling several times before the formal task began, with special instructions and demonstrations for those labels that were easily confused (e.g., the presence of such confusing descriptions as “going from strength to strength” and “increasing instead of decreasing” in the utterance). After clarifying the criteria, we had a full practice of tagging and regularly discussed the difficulties and questions encountered in the process of labeling. In the formal labeling stage, each sentence to be labeled will be labeled by two researchers respectively. If their labeling results are the same, then the label of this sentence will be recorded; if there are differences, we will organize a discussion among all the members to determine the final label; and we will not include those sentences whose labels are difficult to determine in the training set. In the end, all sentences in the to-be-tagged sentence pool, except those for which labels were difficult to determine, were categorized under three labels covering positive, negative, and neutral sentiments (categorizing words describing the status quo such as “economic fluctuations”, “industrial restructuring”, “resource consolidation”, “changes in economic forms”, etc. as neutral sentiments). “economic fluctuations”, ‘industrial restructuring’, ‘resource consolidation’, ‘changes in economic forms’ and some other words describing the status quo were categorized as neutral sentiments). See Table 1 for specific word selection.
Step 4: Train the model using deep learning methods.
With the rise of Transformer in 2017, the attention mechanism can capture the internal dependencies of sequences, so that the text is not limited to textual representations, but linked to contextual information. We will use the Transformer structure-based LERT model for the classification task, using its built-in Tokenizer function to quickly convert sentences into the format needed for LERT model training. We divide all the labeled sentences into training set, validation set and test set in the ratio of 8:1:1. Meanwhile, in order to compare the classification performance between different models, we will use the same Transformer structure for the experiments, including BERT, RoBERTa, BART, ALBERT, and many other deep learning models.
The main purpose of the model is to determine the sentiment tendency of tweets related to “economic news”. For this kind of classification model, the performance of the model is usually measured by Precision, Recall and Accuracy. Considering the uneven distribution of the number of labels of each type in the training set, the F1-Score is usually used to measure the overall classification ability of the model. Among the four types of metrics, Precision is the proportion of samples predicted by the model to be in the Positive category that are actually in the Positive category. A model with high Precision means that it can accurately identify samples that are truly Positive, reducing the possibility of false positives. In the context of this thesis, Precision measures the proportion of sentences that the model considers to be related to “economic news” whose true label is also related to “economic news”, and Recall measures the proportion of sentences predicted to be in the Positive category out of a sample of sentences that are actually in the Positive category. Recall measures the proportion of all samples that are actually in the Positive category that are predicted to be in the Positive category. A model with high Recall means that it can find as many samples as possible that are actually in the Positive category, reducing the likelihood of underreporting. The ability to correctly categorize tweets is more important in the context of this thesis, where there may be multiple sentences in the tweets indicating information related to “economic news”. Comparing the performance of different models on the same training set (see Fig. 1), we can find that the precision, recall, correctness, and F1-Score of the LERT model reach 80%, 70%, 86%, and 76%, respectively, and the LERT model only lags behind the BERT in terms of Recall, but after taking the importance of Precision into consideration, the LERT model has the highest F1-Score among the models trained. However, after considering the importance of Precision, the F1-Score of LERT is the highest among the trained models, according to which we choose LERT as the sentence classification model. Figure 1 compares the performance of different models, and it can be found that the combined classification ability (Fig. 1) of LERT and BERT is much higher than that of the common classification models.
Step 5: Constructing Sentiment Analysis Indicators Using the LERT Model.
Based on the LERT large language model, we predict all the texts in the 2013–2023 prediction database, and determine the sentiment analysis related to “economic news”. Specifically, considering the lag of entrepreneurship, we categorize the sentiment of the news texts in the current month and the previous two months as the current month’s sentiment. As the news sentiment of the current month, for example, if we want to measure the ENS of December 2023, we need to count the news texts of October, November and December as the text source. Following the above idea, we construct discrete variables for ENS, i.e., news with a very pronounced bearish bias is regarded as a very positive sentiment and categorized as 2, bearish bias is categorized as a positive sentiment and categorized as 1, very pronounced bearish sentiment is regarded as a very negative sentiment and categorized as − 2, general bearish sentiment is regarded as a negative sentiment and categorized as − 1, and other neutral sentiments are categorized as 0. The whole process design is shown in Fig. 2.

Flowchart of LERT model measurement.
Urban entrepreneurial vitality
The calculation of UEV is based on the number of new enterprises added each month, which reflects the scale of the unemployed population in the region. Specifically, through the China Business Registration Database, the number of new enterprises added each month in 314 cities from January 2014 to December 2024 was selected as the variable of entrepreneurial vitality for that city in that month.
Control variables
Referring to existing studies, price level (CPI), economic development level (PGDP), acceptance of new things (ANT), social innovation atmosphere (SIA), regional education level (REL), population density (PD) are selected as the control variables, and the specific measurements are shown in the Variable Definition Table (Table 2), and the descriptive statistics of the related main variables are shown in Table 3.
Data sources
In this thesis, the news sentiment data comes from the content of official media microblogs in each city, the entrepreneurial vigor data mainly comes from the enterprise database of Enterprise Search, and the data of other variables comes from the CSMAR and Wind databases. Among them, the data start time is January 2013, the reason is that since 2013, the decline of traditional thesis media, the rise of digital media, with the rise of smart APP terminals, more and more people through the Internet to obtain fragmented news information, therefore, 2013 was selected as the sample start time, and the news is characterized by rapid dissemination, so the month span was selected as the time unit It is in line with the effective time and dissemination cycle of news sentiment. In addition, the raw data are processed as follows: first, outliers are eliminated and 1% shrinkage is performed. Second, the samples with fewer missing values are linearly interpolated, and the processed sample observations contain 37,052 sample data from 314 cities.
Estimation strategy
First of all, in order to effectively study the impact of ENS on entrepreneurial vigor, this thesis constructs a multidimensional fixed effect model with the following model design.
$$UEV_{{{\text{it}}}} = \alpha_{1} + \beta_{1} ENS_{{{\text{it}}}} + \phi X_{{{\text{it}}}} + \delta_{{\text{i}}} + \gamma_{{\text{t}}} + \varepsilon_{{{\text{it}}}}$$
(1)
where UEV is the explanatory variable UEV, ENS is ENS, and β1 is the effect of ENS on UEV, which is the estimator focused on in this thesis. When β1 is significantly positive, it indicates that there is a significant promotion effect of ENS on UEV, and when β1 is significantly negative, it indicates that there is a significant inhibition effect of ENS on UEV. xit is the group of control variables, δi is the city individual fixed effect, γt is the time fixed effect, and εit is the random disturbance term.
Second, in order to effectively test the channel influence effect of ENS on UEV, this thesis constructs the channel mechanism test model (2), in which Mit is the mechanism variable, and if the coefficient β1 exists significance, it indicates that the ENS is able to influence UEV through the channel mechanism variable M. The meanings of the remaining variables are the same as the benchmark regression.
$$M_{{{\text{it}}}} = \alpha_{1} + \beta_{1} ENS_{{{\text{it}}}} + \phi X_{{{\text{it}}}} + \delta_{{\text{i}}} + \gamma_{{\text{t}}} + \varepsilon_{{{\text{it}}}}$$
(2)
Finally, in order to effectively test the moderating effect of ENS on UEV, this thesis constructs a moderating mechanism test model (3), in which Zit is the moderating variable, ENSit×Zit is the cross-multiplier term between ENS and moderating variable, and if the coefficient β1 is significantly positive, then it indicates that there is a facilitating effect of the moderating variable on the main effect, and vice versa, if the coefficient β1 is significantly negative, then it indicates that the moderating variable can have an inhibitory effect on the main effect, and the rest of the variables have the same meaning as the benchmark regression.
$$UEV_{{{\text{it}}}} = \alpha_{1} + \beta_{1} ENS_{{{\text{it}}}} + \beta_{2} ENS_{{{\text{it}}}} \times Z_{{{\text{it}}}} + \beta_{3} Z_{{{\text{it}}}} + \phi X_{{{\text{it}}}} + \delta_{{\text{i}}} + \gamma_{{\text{t}}} + \varepsilon_{{{\text{it}}}}$$
(3)
link


